02 · Geospatial AI research platform
Urban Flood Intelligence
● Live · Kolkata pilot
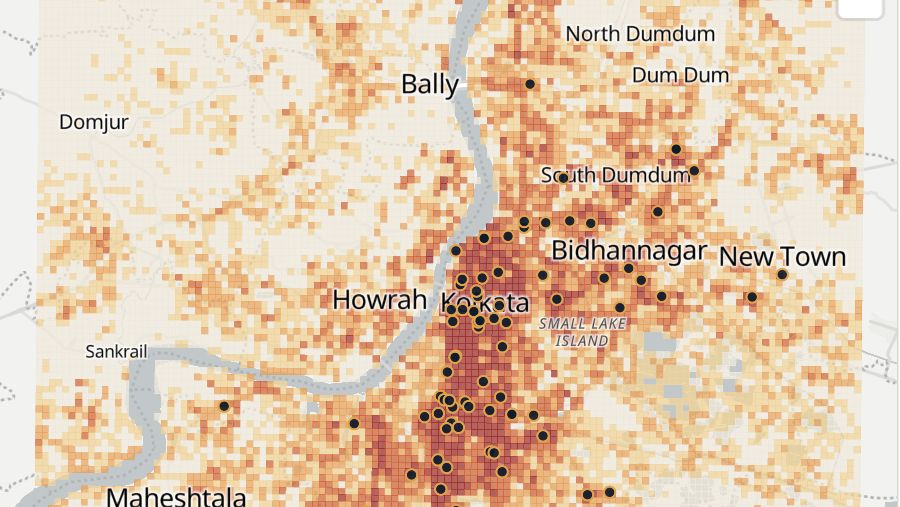
Almost every monsoon, streets in Kolkata go under water. Urban Flood Intelligence shows where that tends to happen, what kind of rain causes it and who lives in those places, built from twelve public datasets and a cited record of past waterlogging.
The problem
Kolkata waterlogs most monsoons, but there is no public, street-level picture of where it tends to happen, or of how much warning rainfall data can actually give.
The approach
Twelve public datasets, from Sentinel-1 radar and elevation to rainfall grids and OpenStreetMap, combined with a source-cited record of documented waterlogging. Seven models and three baselines rank 250 m cells, tested on held-out city blocks, explained with SHAP and given bootstrap uncertainty.
What it is
An open-source research platform for urban waterlogging, piloted in Kolkata. It ranks every 250 metre square of the city by how likely it is to waterlog after heavy rain, compares rainfall sources, catalogues 94 past events and shows how many people and facilities sit in the most affected areas.
It is a research prototype, not an official warning service, and it says so on every page.
What it found
Documented waterlogging locations can be ranked well: ROC-AUC 0.86 on city blocks the model never saw, and 0.88 for localities first reported in 2025–26. A terrain-only index scores below chance, which points to urban form and drainage, not just low ground.
Rainfall separates waterlogging days from ordinary ones (gauges 0.91, satellite and reanalysis products close behind), but that skill falls to about chance with a 24-hour cut-off. Waterlogging here is a same-day phenomenon.
Sentinel-1 radar cannot label urban waterlogging directly: 258 image pairs show no rainfall-driven new open water in built-up cells. Radar is used only as a feature.
How it was tested
Models were validated on spatial blocks and on held-out parts of the city rather than random splits, which in this data overstate precision-recall performance by about half. Uncertainty comes from 30 bootstrap ensemble members, and the work starts from a scoping review of 95 papers.
What it does not claim
Absolute flood probabilities, causal effects, transfer to other cities, or an operational forecast. The observation record is incomplete and the method says how.
Built with
- Python
- scikit-learn
- XGBoost
- LightGBM
- PyTorch
- SHAP
- GeoPandas
- rasterio
- xarray
- FastAPI
- React
- TypeScript
- MapLibre GL
- ECharts
Open the live site ↗Source on GitHub ↗ See it in the room →
Next Nox